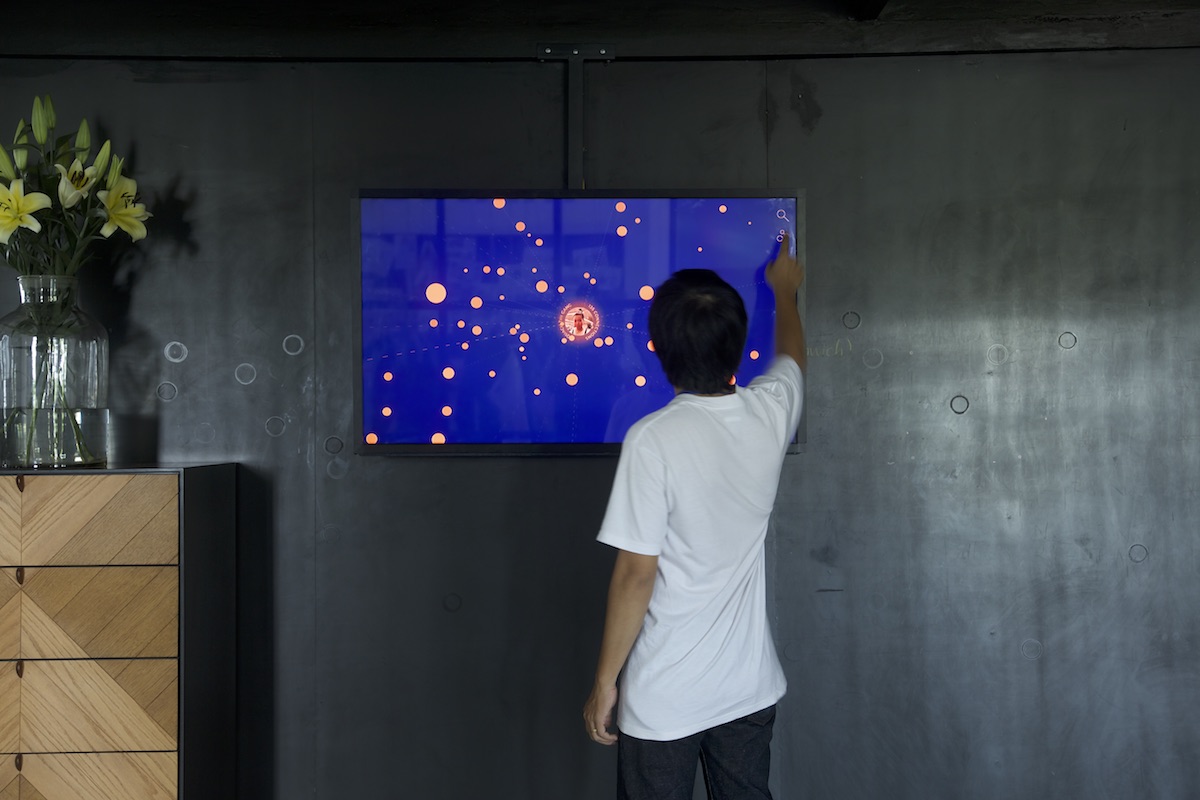
An interactive social graph of connections.
28 June 2018
#3 | Circle of friends

28 June 2018

An interactive social graph of connections.


Humans are a profoundly social species; our drive to connect with others is embedded in our biology and evolutionary history.
Social connection is the feeling of belonging to a group and close to other people.
We have 175 staffs and counting. How have their friendships evolved since they joined the company? Who eats alone at work?
Our initial idea is to find out how well are our staff connect with each other.
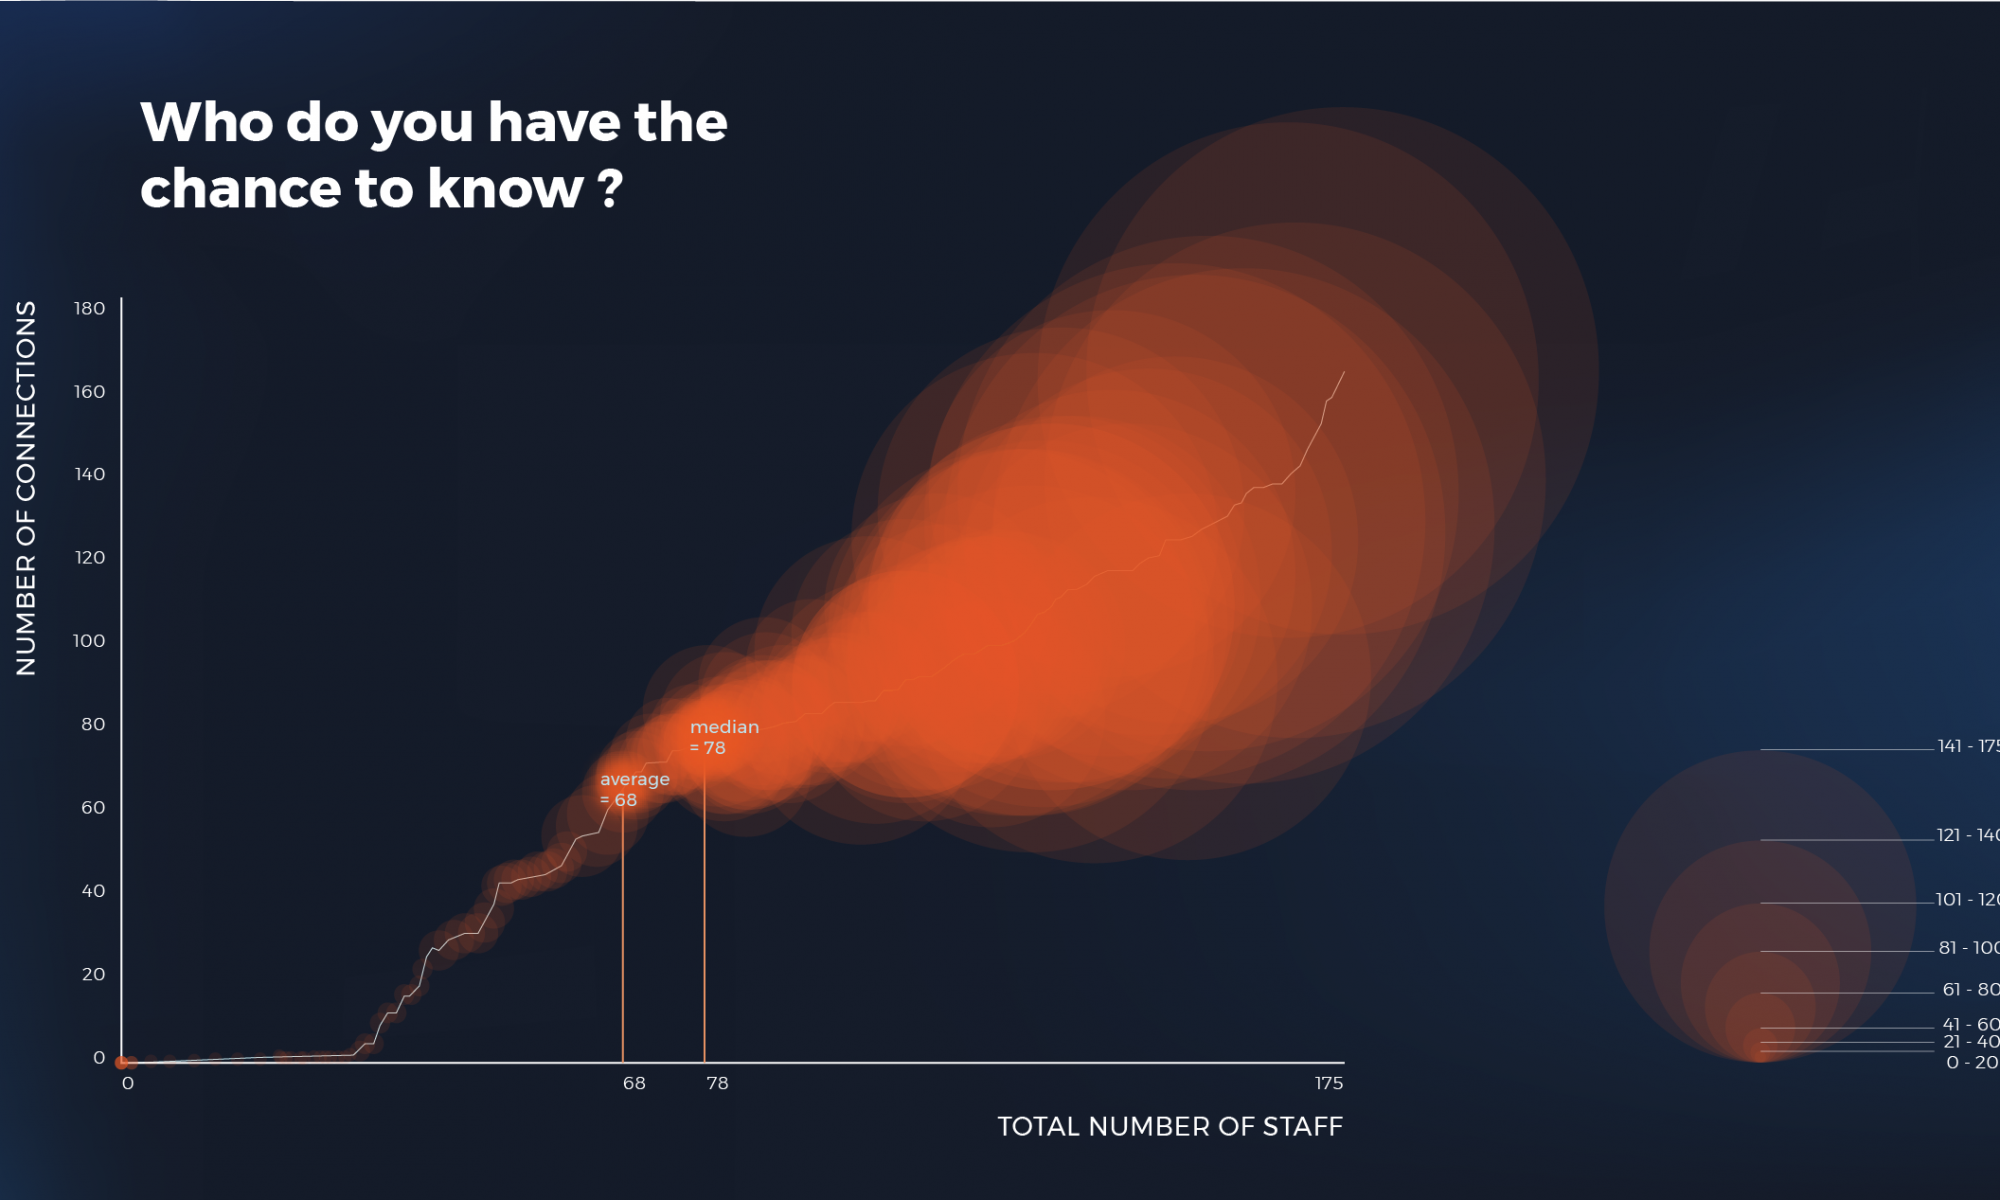
After collecting the data, We’re very surprised by the number. The average connection is 68, and the medium is 78.
However, if we look at individual numbers, 25% of the people have less than 20 connection. it means we still have a lot of work to do.
We want to make sure everyone feels included and nobody is left out.
Our next step is to look into the dynamics between departments, create platforms and ventures to link and connect people.
We’re also planning to build more recreational areas for our team to relax, hangout and reenergize.
VEVOLUTION3EVOLUTION3EVOLUTION3
OLUTION3EVOLUTION3EVOLUTION3
VOLUTION3EVOLUTION3EVOLUTION3
OLUTION3EVOLUTION3EVOLUTION3
email  hello@evolution3.com
![]() EVOLUTION3
EVOLUTION3
![]() EVOLUTION3
EVOLUTION3
![]() EVOLUTION3
EVOLUTION3
![]() EVOLUTION3
EVOLUTION3